What is a good sell-through rate?
The season sold through. The margin still disappeared. That is usually the moment somebody asks what a good sell-through rate looks like, because the number on the report said the buy was fine.
The number was probably right. It was also unreadable on its own. A sell-through rate is only meaningful next to the price the units sold at and the window you measured over. Change either and the same percentage describes a different business.
This page gives you the ranges and the reasoning behind them. It does not give you a table of industry averages, because a benchmark you cannot trace to a comparable brand, channel and window will lose you money faster than having no number at all.
What sell-through measures, and over what window
Sell-through is units sold divided by units available, over a stated period. Units available means what you had to sell: opening stock plus anything received during the window.
The formula is trivial. Two decisions inside it do the work.
The window. A week, a month, twelve weeks, or the whole season. Nothing about the number means anything until the window is fixed.
The denominator. Some teams use opening stock. Others use total intake for the season, including units that had not landed yet. The second version makes early weeks look terrible and late weeks look strong, on the same trade.
Fix both and write them down. Half the arguments about sell-through are two people using different denominators and neither of them saying so.
Weekly against season-to-date
The two views answer different questions and they belong in different meetings.
Weekly sell-through is a trading signal. It tells you the rate of sale right now, so you can project when an option will be gone. Twelve per cent a week on an option with eight weeks of the season left means you run out early, and the decision is a repeat buy. Three per cent a week on the same option means you finish with half of it, and the decision is a price move or a phasing change.
Season-to-date sell-through is a scorecard. It tells you how much of the buy has cleared and how much risk is still on the shelf. It is the right number for a post-season review and the wrong number for a Tuesday, because by the time it looks bad the options are already old.
Use weekly to decide. Use season-to-date to learn. Watching only the cumulative number is how a bad drop stays invisible until week ten.
The ranges worth holding in your head
Ranges are useful as a starting posture. Treat them as prompts for the next question.
Weekly rate of sale. Somewhere around 5 to 10 per cent a week on a seasonal option is a healthy trade in most direct-to-consumer catalogues. Above about 15 per cent, you are selling out early. Below about 3 per cent, the option will not clear at full price and you already know it in week three.
Season-to-date, at the point markdown normally starts. Roughly 60 to 75 per cent cleared before the first planned promotion is a comfortable position on seasonal product. It leaves a tail you can clear without wrecking the margin.
End of season. Most brands are targeting the high eighties or low nineties by the time the season closes, with the remainder carried or jobbed.
Core carry-over. These ranges do not apply. Core is a replenishment problem, so the number to watch is weeks of cover, and running an intentionally low sell-through is correct if it protects availability.
Two things move all of the above more than the industry you are in. Season length, and how much of the buy landed on day one. A brand that phases intake across ten weeks will never post the same early sell-through as a brand that lands everything in week one, and neither one is better at buying.
Two businesses with the same 80 per cent
Take two options. Both finish the season at 80 per cent sell-through.
The first cleared 68 per cent at full price and the last 12 per cent at 30 per cent off. On a 68 per cent gross margin that option is comfortably profitable, and its markdown was the cost of clearing a tail.
The second cleared 22 per cent at full price. The rest went at 40 and then 50 per cent off, in two waves, starting in week six. Same 80 per cent. Realised gross margin lands closer to 45 per cent, and returns on discounted units usually run higher, so contribution is thinner again.
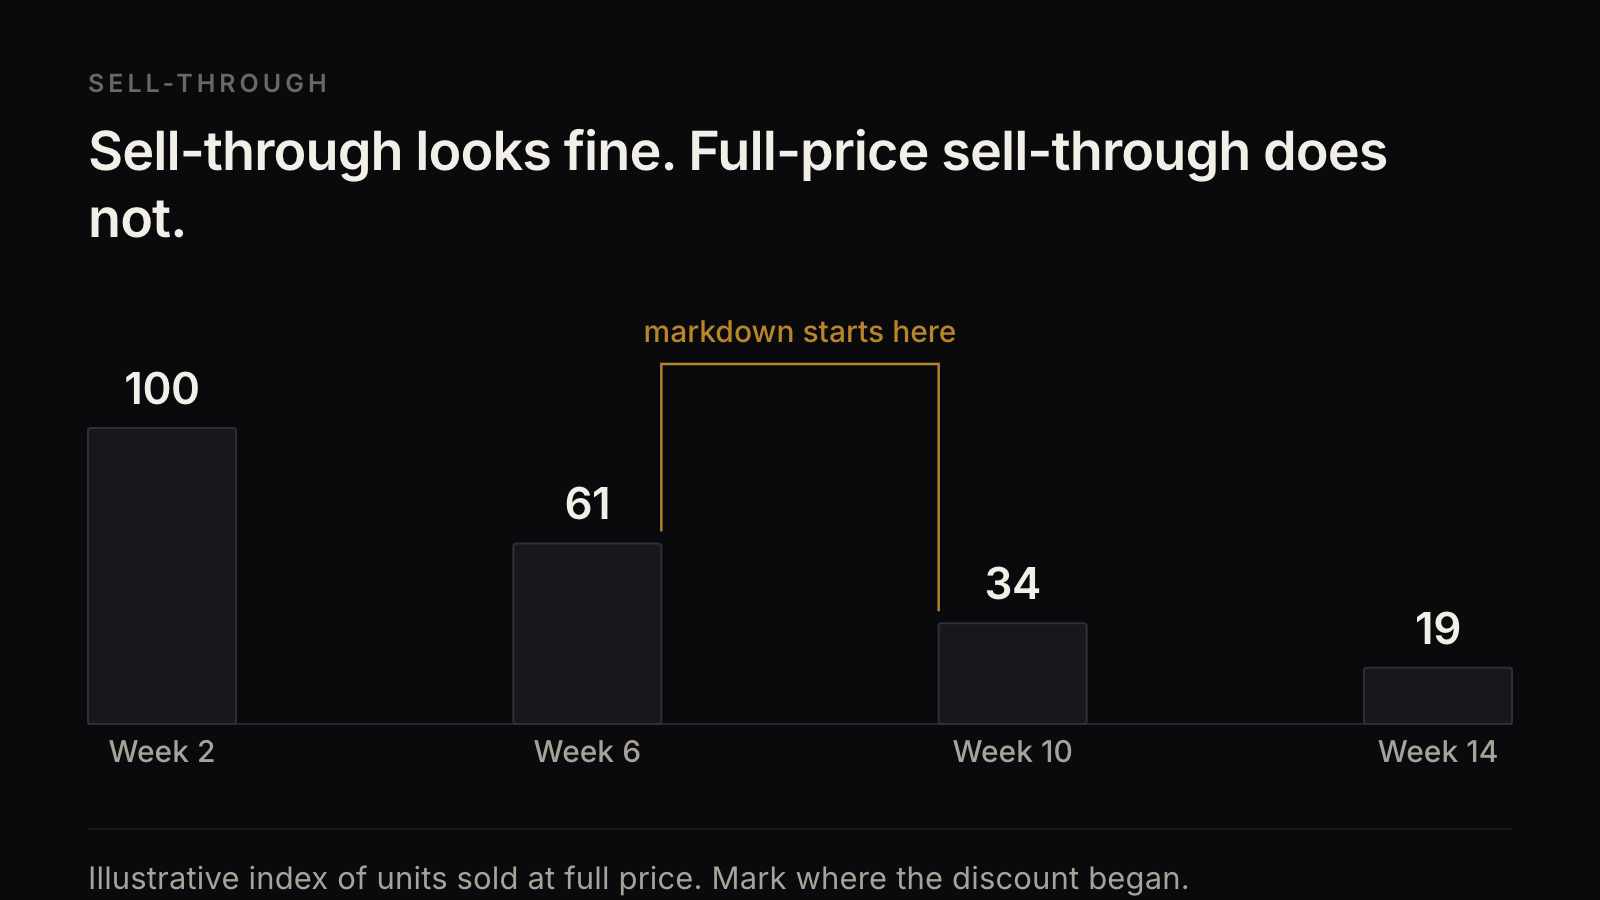
One report. Two completely different pieces of trading. The percentage cannot tell them apart, which is why the useful version of this metric is full-price sell-through: units sold at full price, over units available. The figure above shows what that looks like when you split the two lines. Blended sell-through holds up. Full-price sell-through falls away after week six, and week six is where the decision actually was.
When discounts destroy margin is the sibling on what that gap costs. Ecommerce contribution margin is the page on the line the markdown lands in.
A high rate can mean you under-bought
A 95 per cent sell-through gets applause in the meeting. Sometimes it deserves it. Often it means you left money on the table.
If an option sold out in week five of a fourteen-week season, you did not sell 95 per cent of the demand. You sold 100 per cent of the stock. The gap between those two is lost sales, and it never appears on a report, because unsold demand leaves no record.
Three signals tell you which one happened. The option sold out well before the season ended. It sold out at full price with no promotional support. Search and product page traffic kept arriving after the stock had gone.
The size and shade version is more common and more expensive. Total sell-through says 88 per cent. The middle sizes went in week four, so from week five you were selling a broken curve to customers who could not buy their size. That option was out of business two months before it was out of stock.
A low rate can be a buying error
A low sell-through gets read as weak demand. Often the demand was fine and the buy was wrong.
Depth. You bought twice what the option could sell in the time available. The rate of sale was normal.
Curve. You bought evenly across sizes or shades when the demand skews. The popular units cleared and the rest sat, so the option looks slow in aggregate.
Phasing. The option landed in week nine of a fourteen-week season. It never had enough full-price weeks, whatever it did per week.
Price. The option was priced above where the customer places it, and the only thing that moved was the discount.
The test is rate of sale against weeks on site. Divide sell-through by the number of weeks the option was actually available at full price. If the weekly rate is healthy and the cumulative number is poor, you have a depth or phasing problem. If the weekly rate is poor from week one, you have a demand or price problem. Those two get fixed in different meetings.
What makes a sell-through number readable
A sell-through number is readable when four things are attached to it.
- The window, stated explicitly, and the same window every time you report it.
- The price it sold at, as a full-price share and a markdown share.
- The weeks available, so a late-landing option is not judged against one that traded all season.
- The level, which means option or SKU. Category sell-through averages winners and losers into a number nobody can act on.
Add contribution and you have something worth taking into a buying meeting. Sell-through tells you whether the stock moved. Contribution tells you whether moving it was worth doing. A brand that reports both by option will make better buys than a brand with a benchmark table and a blended percentage.
TwoKai starts with the outcome. A sell-through read you can buy against. Then we engineer the route.
What's missing
This page can tell you what sell-through measures, which window to use for which decision, the ranges worth starting from, and why the same percentage can describe two different businesses. It cannot tell you your own markdown-adjusted sell-through curve by option and by channel, or how much demand you never recorded because the middle sizes went early. That curve has to be built on your own orders and your own intake dates.
Related: When discounts destroy margin · Ecommerce merchandising: what to measure under the word · Unit economics for a Shopify fashion or beauty brand
If you want that curve built and read properly, Explore an opportunity with TwoKai.