SKU rationalisation: how to decide what to stop buying
SKU rationalisation is the decision about which options to keep and which to stop buying. There are too many options. Contribution is thin. Everyone agrees the range is too wide and nobody wants to cut anything, because every option has somebody in the room who will defend it.
That stalemate is normal. It happens because the cut list gets argued as taste, or settled with a spreadsheet sort. The cut list is a contribution question. A sort on revenue will get it wrong in a predictable way.
Start with contribution per option
Revenue tells you an option sold. Contribution tells you whether selling it was worth doing.
Build the line per option. Revenue after discount, minus cost of goods, minus returns and the cost of processing them, minus fulfilment and payment fees. Ecommerce contribution margin is the page on what belongs in that line and what does not.
Then add the cost of the option existing at all. Sample. Photography. Copy and listing. The working capital sitting in unsold units. Most brands never allocate this, so every option looks free once the stock has been bought.
Sort by contribution and the range usually falls into three groups. Options that clearly earn. Options that clearly do not. A middle band where contribution is close to zero, which is where the real argument lives.
The clear losers are rarely a surprise. What surprises people is how many of them look respectable on a revenue report, because they sold through fine at a price that never covered the goods.
The job an option does in the range
Contribution alone is not a verdict. Some options earn their place by making other options sell.
The entry price point. The £29 tee or the £14 lip balm that gives a first-time customer a low-risk way in. Its own contribution can be poor while it opens the relationship.
The size or shade anchor. The extreme end of a curve. It sells slowly by design. Removing it tells a group of customers you do not stock them, and they stop looking at the rest of the range.
The gift. Seasonal, low margin, and often the reason a basket exists in November.
The basket completer. The belt with the trousers. The primer with the foundation. It rarely leads a session and it frequently raises order value. How to increase average order value is the sibling on how that works.
The repeat driver. A first product that produces a second order without another discount. Its first-order contribution can be thin and its cohort value strong. Customer retention in ecommerce is the page on measuring that properly.
An option that does one of those jobs is load-bearing. Cut it and something else falls. An option that does none of them, and earns nothing, is dead weight carrying a photography cost.
Slow does not mean unnecessary
A slow SKU and an unnecessary SKU look identical on a rate-of-sale report.
The difference is what happens to the rest of the range without it. A slow option that appears in 18 per cent of baskets is holding order value up. A slow option that only ever sells alone, to customers who buy once, is holding cash and shelf space.
Two checks separate them, and both run on order data you already have.
Basket co-occurrence. How often does this option appear in an order with something else? What is the average value of orders containing it, against orders without it?
First-product repeat. When this option is the first thing a customer buys, does a second order arrive, and does it need a discount to arrive?
Run both across the bottom third of the range. You will usually find a handful of quiet options doing real structural work, and a larger group that has simply survived several planning cycles without being noticed.
Revenue falls and contribution rises
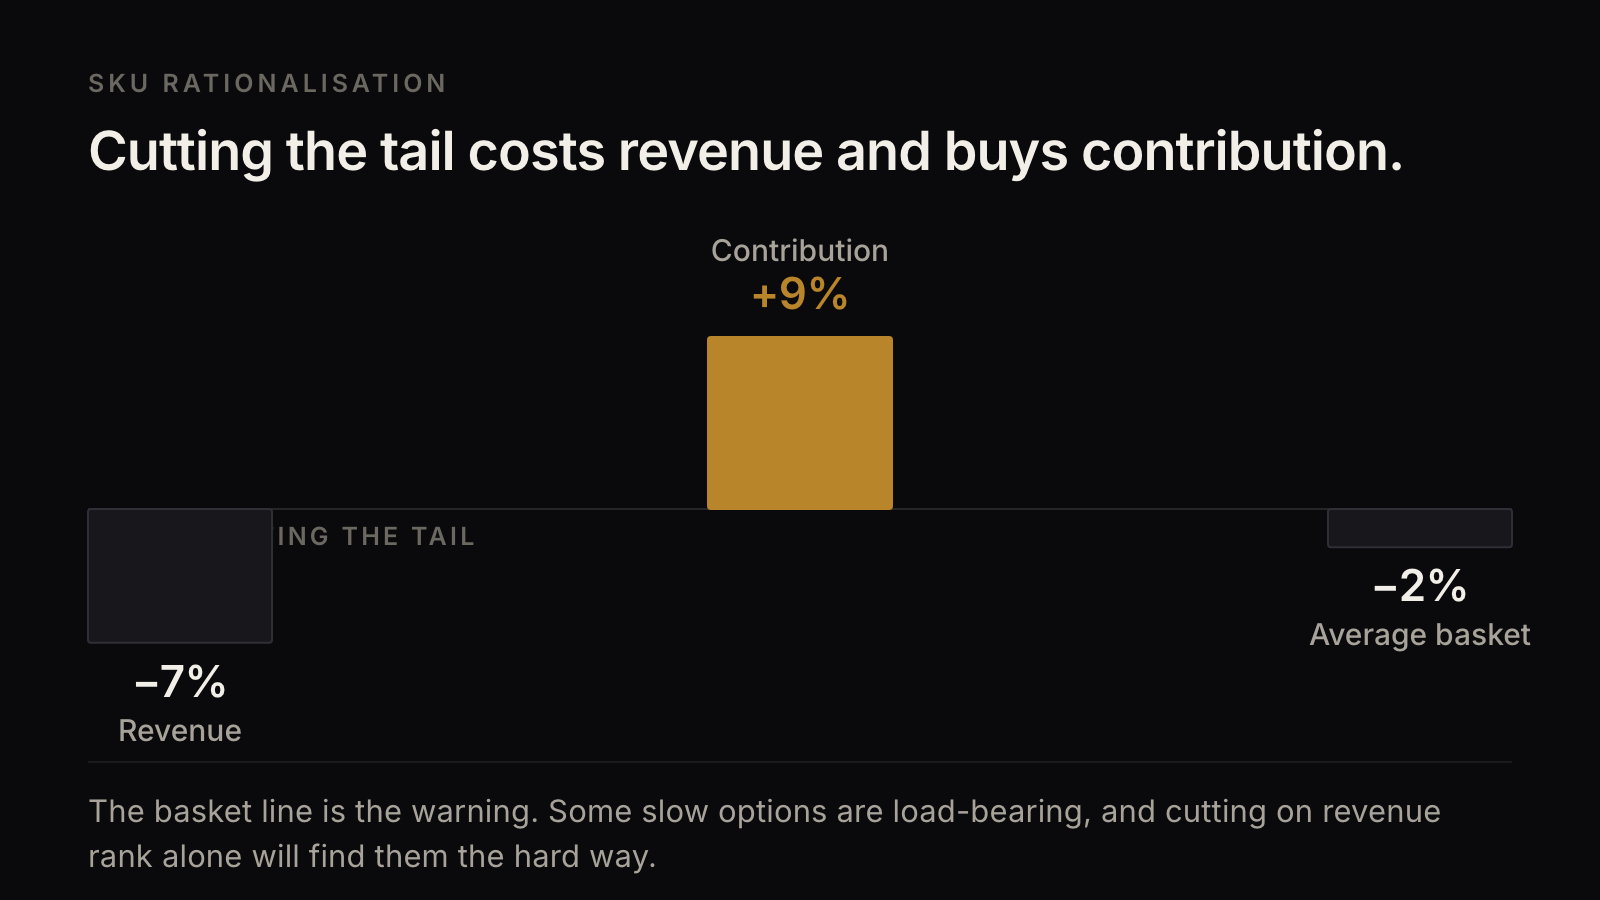
The figure above shows the shape of a tail cut done properly. Revenue down 7 per cent. Contribution up 9 per cent. Average basket down 2 per cent.
That happens for four reasons at once.
Markdown falls. Tail options are the ones that get cleared. Removing them removes the discount that came with them.
Returns fall. Options with a weak size or shade fit sit in the tail for a reason, and they return at above the brand average.
Working capital comes back. Cash that was sitting in ones and twos is available for depth on core, which is where the margin is.
Fixed content cost drops. Fewer samples, shoots and listings for the same season.
The basket effect is the part to watch. Losing 2 per cent of order value is a fair price for 9 per cent more contribution. Losing 8 per cent means you cut something load-bearing, and the reason will be in the co-occurrence data you skipped.
Expect a finance conversation about the revenue line. Have both numbers ready before the meeting.
Why cutting on revenue rank is the classic mistake
The standard move is to sort options by revenue, draw a line at the bottom 20 per cent, and cut. It is fast and it fails in three specific ways.
It cuts high-margin, low-volume options. A £180 coat at 72 per cent margin ranks below a £35 discounted tee at 31 per cent margin. Revenue rank inverts the thing you are trying to protect.
It cuts newness before it has traded. An option that landed in week nine has less revenue than one that landed in week one, whatever the rate of sale. Cut on revenue and you will remove the options with the shortest history rather than the weakest performance.
It cuts structure. Entry price points, curve anchors and basket completers all sit low on revenue by design. They are the exact options the sort will find first.
Sort by contribution instead, then hold the bottom band against the list of jobs, then check basket and repeat. Three passes rather than one. It takes an afternoon and it stops you cutting the option that was holding the category together.
TwoKai starts with the outcome. A narrower range that contributes more. Then we engineer the route.
What's missing
This page can tell you how to build the cut list, why contribution beats revenue rank, and how to tell a slow option from a necessary one. It cannot tell you which of your options are load-bearing for basket size and repeat purchase. That answer sits in your own order lines, in the co-occurrence between options and in what your first-time customers do next.
Related: Ecommerce contribution margin · Ecommerce merchandising: what to measure under the word · Customer retention in ecommerce
If you want the cut list built on your own orders, Explore an opportunity with TwoKai.