Open to buy and demand forecasting: what the plan commits
The forecast was wrong again. The cash is already committed. The units are on a vessel and the season starts in six weeks.
Most brands respond by trying to make the forecast better. That is the wrong target. Forecast accuracy at option level has a ceiling you will hit quickly, and the money is not made there. It is made in how fast you trade the gap between the plan and what actually sells.
What an open-to-buy plan commits you to
Open to buy is the value of stock you are still allowed to order for a given period, once you account for what you already own and what is already on order.
The arithmetic is simple. Planned sales for the period, plus planned closing stock, plus planned markdown, minus opening stock, minus stock already on order. What is left is the money you can still spend.
Three things make it consequential rather than clerical.
It is a cash plan. Every pound of open to buy you use becomes stock. Stock is cash you cannot spend on media, headcount or the next season until it sells.
It closes early. For imported product, the buy is committed against a production and container calendar. That means the season's cash is spent three to six months before the first order arrives.
It is set at a level above the decision. Open to buy is usually planned by department and month. The commercial outcome happens at option and week. The plan can be right and the mix still wrong.
By the time you know whether the forecast was good, the money has gone. That is the structural fact everything else follows from.
The forecast is a cash decision first
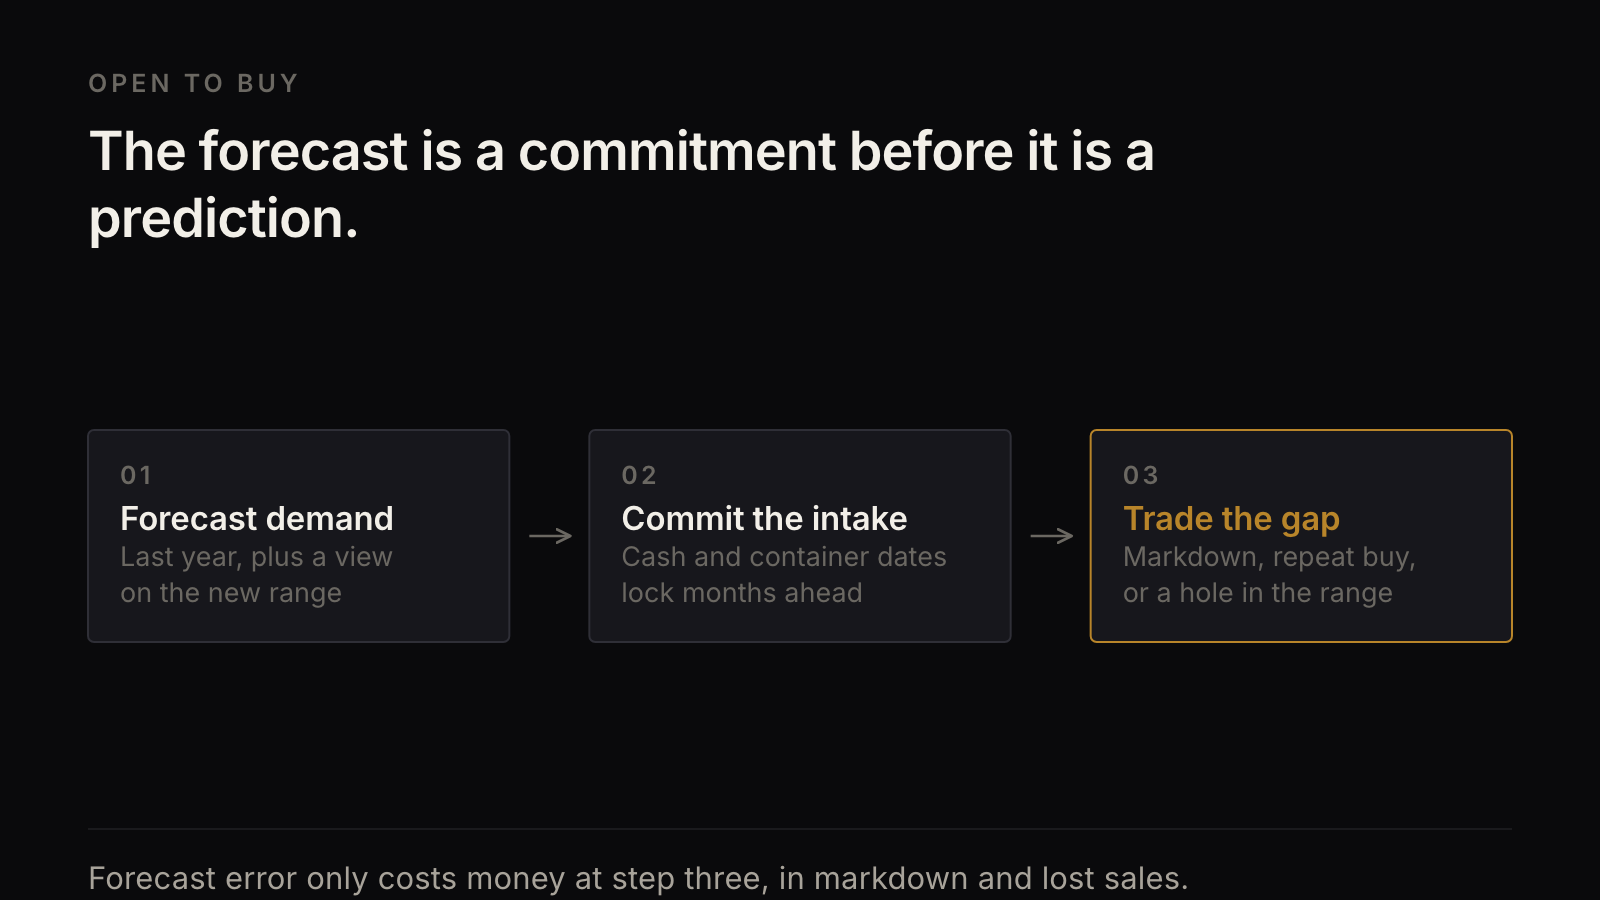
A demand forecast looks like a prediction. For most of its life it functions as a commitment.
When you sign the buy, you are fixing four things: how much cash leaves the business, when it leaves, what it turns into, and how long you are exposed before any of it comes back. The forecast is the argument you used to justify those four. It stops being a prediction the moment the purchase order is signed.
That changes what a good forecast is for. Its job is not to be right about units. Its job is to be defensible about risk. A forecast that says "we are confident on core and guessing on newness, so we will commit deep on core and shallow on newness with a repeat option" is more useful than a tighter number with no stated confidence.
Two practical consequences follow. Buy core deep, because history exists and availability protects margin. Buy newness shallow with a repeat mechanism, and accept the higher unit cost on the repeat as the price of not owning the miss. Ecommerce merchandising is the page on the range decisions that sit alongside this one.
Where forecast error actually costs money
Nobody has ever been billed for a mean absolute percentage error. The cost arrives in two places, and they behave differently.
Markdown, when you over-forecast. You own units the demand did not want. The cost is the discount required to clear them, plus the higher return rate on discounted orders, plus the effect on customers who learn to wait. When discounts destroy margin is the page on how that compounds.
Lost sales, when you under-forecast. You sold out early. The cost is the contribution you never earned, and it never appears on a report, because unsold demand leaves no record. This is why over-forecasting feels safer than it is. One error is visible and the other is invisible.
The two costs are asymmetric and the asymmetry is specific to your margin. At 70 per cent gross margin a lost sale costs far more than a 30 per cent markdown, so leaning towards depth on proven product is rational. At 45 per cent margin the arithmetic reverses and over-buying is the expensive mistake.
Work in error bands rather than a single figure. Core carry-over should sit inside 10 to 15 per cent. Seasonal newness at option level will run 40 to 60 per cent out and no process will fix that. Plan for the band you are actually in. Unit economics for a Shopify fashion or beauty brand is the sibling on the margin that decides which side to lean.
A good forecast loses to a bad markdown call
Two brands buy the same range. One forecasts well and one does not. The one that forecast badly can still finish the season ahead.
The mechanism is speed. Brand A commits, watches weekly sell-through, and moves in week four. It takes 20 per cent off two slow options, brings a repeat buy forward on the option running hot, and re-phases a late delivery. Brand B commits, waits for the season review, and clears at 50 per cent in week eleven with everyone else.
Brand B forecast more accurately in aggregate and realised a much worse gross margin. It owned the same information four weeks later and by then only one lever was left.
This is where the operating habit matters more than the model. A weekly trading review, with rate of sale and full-price sell-through by option, converts a forecast miss into a small decision. A quarterly review converts the same miss into a markdown event.
What to forecast at option level
Not everything deserves an option-level number. Forecast at option level where the decision is at option level and history exists.
Worth it. Core carry-over, because the history is real and depth protects margin. Options with long lead times where a repeat buy is impossible. Anything where a stock-out costs you a customer rather than a unit.
Not worth it. New colourways in an established style, which are better handled as a share of the style total. The long tail, where the forecast will be wrong and the exposure is small. Anything you can repeat inside four weeks, where a trigger beats a prediction.
When the question is which options to stop buying, that is SKU rationalisation.
A sequence that works without new software:
- Plan open to buy by month and department. Write down the cash and the intake dates.
- Split the buy into core, newness and tail. Set a confidence level and an error band for each.
- Forecast core at option level. Forecast newness at style or family level and allocate down.
- Set the trading triggers before the season starts. The rate of sale that fires a repeat buy. The rate that fires a price move. The week you check.
- From week two, review weekly. Rate of sale, full-price sell-through, and weeks of cover by option.
- Log every gap and what you did about it. That log is next season's forecast input, and it is better than last year plus ten per cent.
Step 4 is the one that gets skipped, and it is the one that pays.
TwoKai starts with the outcome. An intake plan you can trade against. Then we engineer the route.
What's missing
This page can tell you what an open-to-buy plan commits, when it commits it, where forecast error turns into money, and what deserves an option-level forecast. It cannot tell you how your intake plan compared with realised demand, which weeks you had a decision available and did not take it, or where your cash is currently trapped by option. That read has to be built on your own purchase orders and order lines.
Related: Ecommerce merchandising: what to measure under the word · When discounts destroy margin · Unit economics for a Shopify fashion or beauty brand
If you want the intake plan read against realised demand, Explore an opportunity with TwoKai.