Break-even ROAS: the target moves by product
Most people searching “break-even ROAS” want a calculator. They want to type in a margin, read a multiple, and put it in the ads manager as a target.
The logic is simple enough to give you here. The calculator version is wrong for almost every fashion and beauty catalogue, and it is wrong in a direction that costs money. It sets the bar too low, so spend that is quietly losing money passes the test.
What is a good ROAS for ecommerce is the judgment page on whether a multiple is healthy, and it touches break-even in a paragraph. This page is the arithmetic underneath it.
What break-even ROAS actually asks
Break-even ROAS asks one question. How many pounds of revenue does an advert have to produce before the order stops losing money?
Work it from the order, not from the campaign. Take one pound of revenue. Subtract every cost that moves with that order. Whatever survives is the money available to buy the order in the first place. Divide one by that share and you have the multiple.
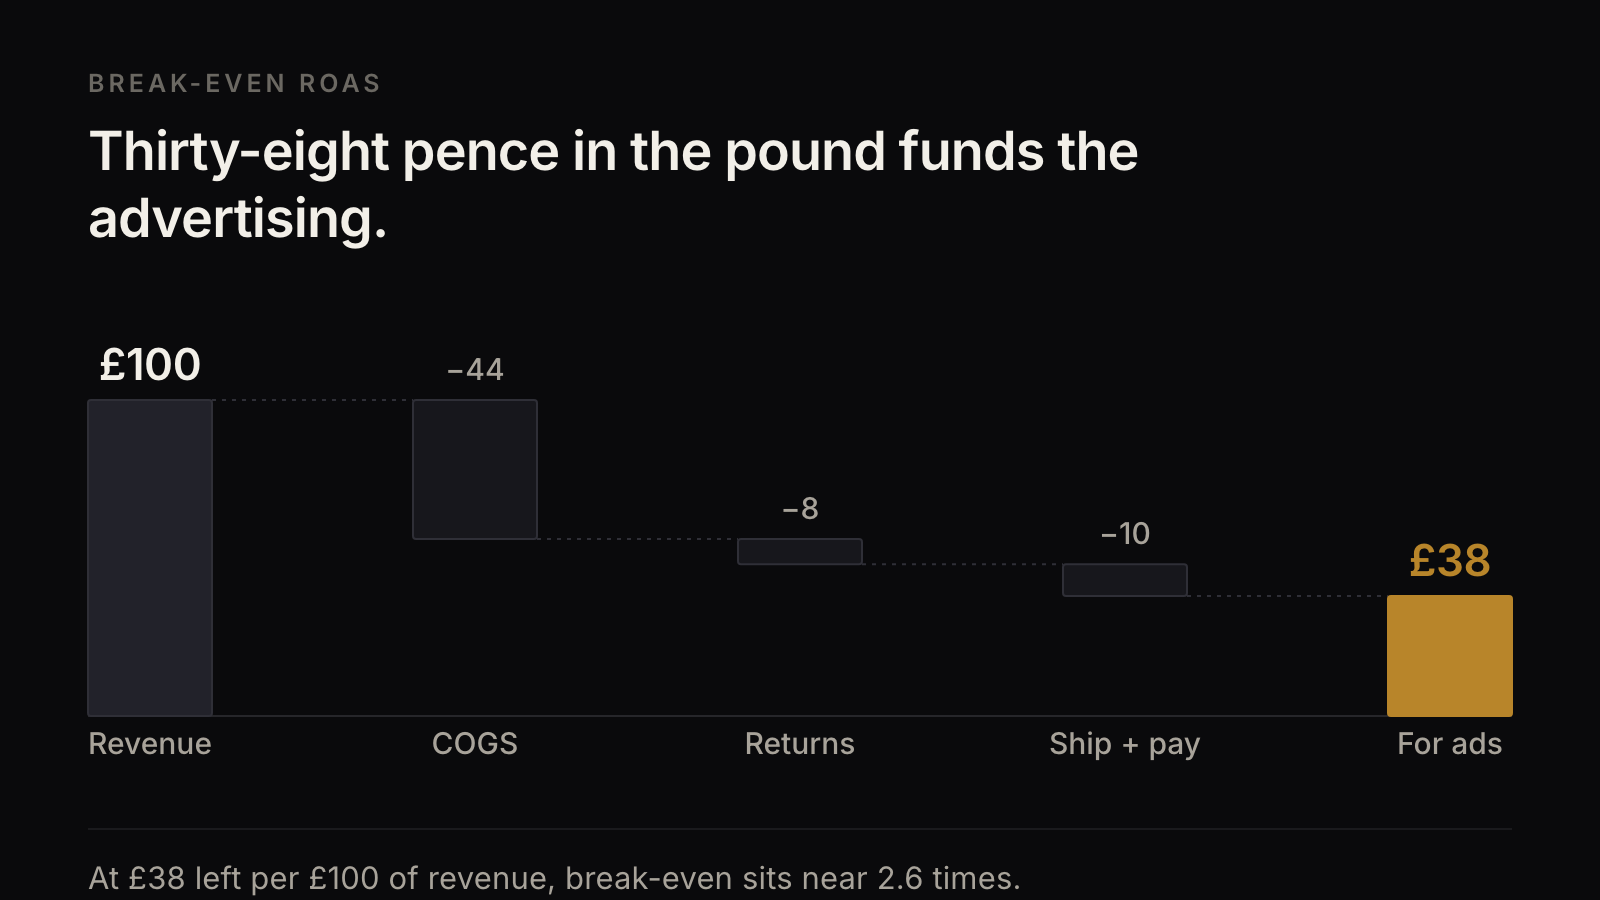
If 38 pence in the pound survives, you can spend 38 pence to win a pound of revenue. That is a break-even ROAS of about 2.6 times.
The important word is “available”. Break-even ROAS is not a profit target. It is the point where the order contributes nothing and nothing is lost. A real target sits above it, by however much contribution the business needs.
Why gross margin alone gives the wrong target
The calculator version uses gross margin and stops. Product cost is 44% of revenue, so gross margin is 56%, so break-even ROAS is 1 divided by 0.56, which is about 1.8 times.
That number is comfortable and it is wrong. It ignores four costs that arrive after the product cost.
Returns. The refund gives back the revenue and rarely gives back the full cost. Outbound shipping is gone. The return leg is a cost. Some units come back late, unsellable, or into a size curve you are about to mark down.
Shipping. Free delivery over a threshold is a cost you carry per order, and it does not scale with margin.
Payment fees. Two to three per cent of the order, plus a fixed pence per transaction, plus the apps sitting on every order.
Discount. A code moves revenue down while product cost stays exactly where it was. Gross margin percentage falls, and the calculator you built in January never hears about it.
Put those in and the same unit needs 2.6 times, not 1.8. A campaign running at 2.2 times looks like a winner against the calculator and loses money on every order.
A worked example on one hundred pounds
Take a full-price order worth £100 of revenue.
- Product cost at 44% of revenue: £44
- Returns at 8% of revenue: £8
- Shipping and payment fees at 10%: £10
That leaves £38. Thirty-eight pence in the pound is available to buy the order. Break-even ROAS is 100 divided by 38, which is about 2.6 times.
Now run the same unit on a 20% code. Revenue is £80. Product cost is still £44, because the garment did not get cheaper. Returns fall to about £6 and shipping and fees to about £9, because they move with revenue.
£80 minus £44 minus £6 minus £9 leaves £21. Break-even ROAS on the discounted order is 80 divided by 21, which is about 3.8 times.
One code moved the target from 2.6 to 3.8. The ads manager did not notice. The target in the ads manager is still 2.6.
The target belongs to the product
Return rate is the biggest single mover, and it varies more inside a catalogue than it does between brands.
Take a jacket with a 30% return rate. Of £100 of demand, £70 stays. Product cost on what stays is about £31. Shipping and payment fees across the demand, including the return leg, are about £14. Handling and the markdown you take on returned stock are about £5. That leaves £20 against the £100 of revenue the platform is reporting, so break-even ROAS is 5 times.
Take a moisturiser with a 4% return rate and a 70% gross margin. Of £100 of demand, £96 stays. Product cost is about £29. Shipping and payment fees are about £9. That leaves £58, so break-even ROAS is about 1.7 times.
Both products sit in the same business. One needs 5 times to stand still. The other is profitable at 2 times. There is no brand-level number that is true for both.
This is where a single company-wide target does the damage. Set it at 2.6 and the jacket keeps getting funded at 3 times while it loses money on every order, and the moisturiser gets switched off at 2 times while it makes money on every order. The blended target does not average the errors out. It makes both of them, in opposite directions, every day.
Ecommerce contribution margin is the sibling on what belongs in the line you are protecting. ROAS vs ROI is the page for which ratio is allowed to approve a commitment.
A sequence you can run this week
- Pick your three highest-spend products. Not categories. Products.
- For each one, write down revenue at the price it actually sells at, including the average discount applied over the last quarter.
- Subtract product cost, then returns at that product's own return rate, then shipping and payment fees.
- Divide revenue by what is left. That is the break-even ROAS for that product.
- Compare each one to the target currently set in the ads manager. Write down the gap.
Three products is enough to see whether one target can serve the catalogue. If the three answers sit more than half a turn apart, the single target is already making decisions for you, and it is making them badly.
Return rate is the number most brands guess at. Pull it by product and by size, not as a company average. In fashion the average hides a size curve. In beauty it hides the difference between a hero SKU and a kit bought on a gift-with-purchase.
TwoKai starts with the outcome. A spend target you can defend per product after the goods come back. Then we engineer the route.
What's missing
This page can give you the break-even logic, the four costs the calculator version drops, and the reason the target belongs to a product rather than a brand. It cannot give you your own break-even by product after returns and markdown. That needs your return rate by size and shade, your real landed cost, and the markdown you actually take to clear a style. Those three live on your orders and your stock, not in a blog. You can check one typed order at the ROAS calculator.
Related: Is your ROAS target making you money? · What is a good ROAS for ecommerce? · ROAS vs ROI: which number can approve a budget? · Unit economics for a Shopify fashion or beauty brand · Check break-even on one order
If you want that measured properly on your own catalogue, Explore an opportunity with TwoKai.