ROAS vs ROI: which number can approve a budget?
People type “ROAS vs ROI” when two people in the same meeting are both right. Paid says the campaign returned four times the spend. Finance says the month lost money. Neither is lying. They are dividing different things.
What is a good ROAS for ecommerce settles whether a multiple is healthy. This page is the sibling. It is about which of the two numbers is allowed to approve a budget, and what happens to the argument when you write both sums down.
What each number divides
ROAS is attributed revenue over ad spend. Revenue on the top. Media cost on the bottom. Nothing else is in the sum.
ROI is profit over the money you put in. Profit on the top. The full cost of the attempt on the bottom.
That is the whole difference, and it is bigger than it sounds. ROAS has one cost in it. ROI has all of them. A ratio with one cost in the denominator will always look kinder than a ratio with every cost in it.
There is a second difference people miss. ROAS uses revenue the platform is willing to claim. ROI should use revenue that actually arrived and stayed, which means after returns and after the discount you applied to win the order.
Where the two numbers separate
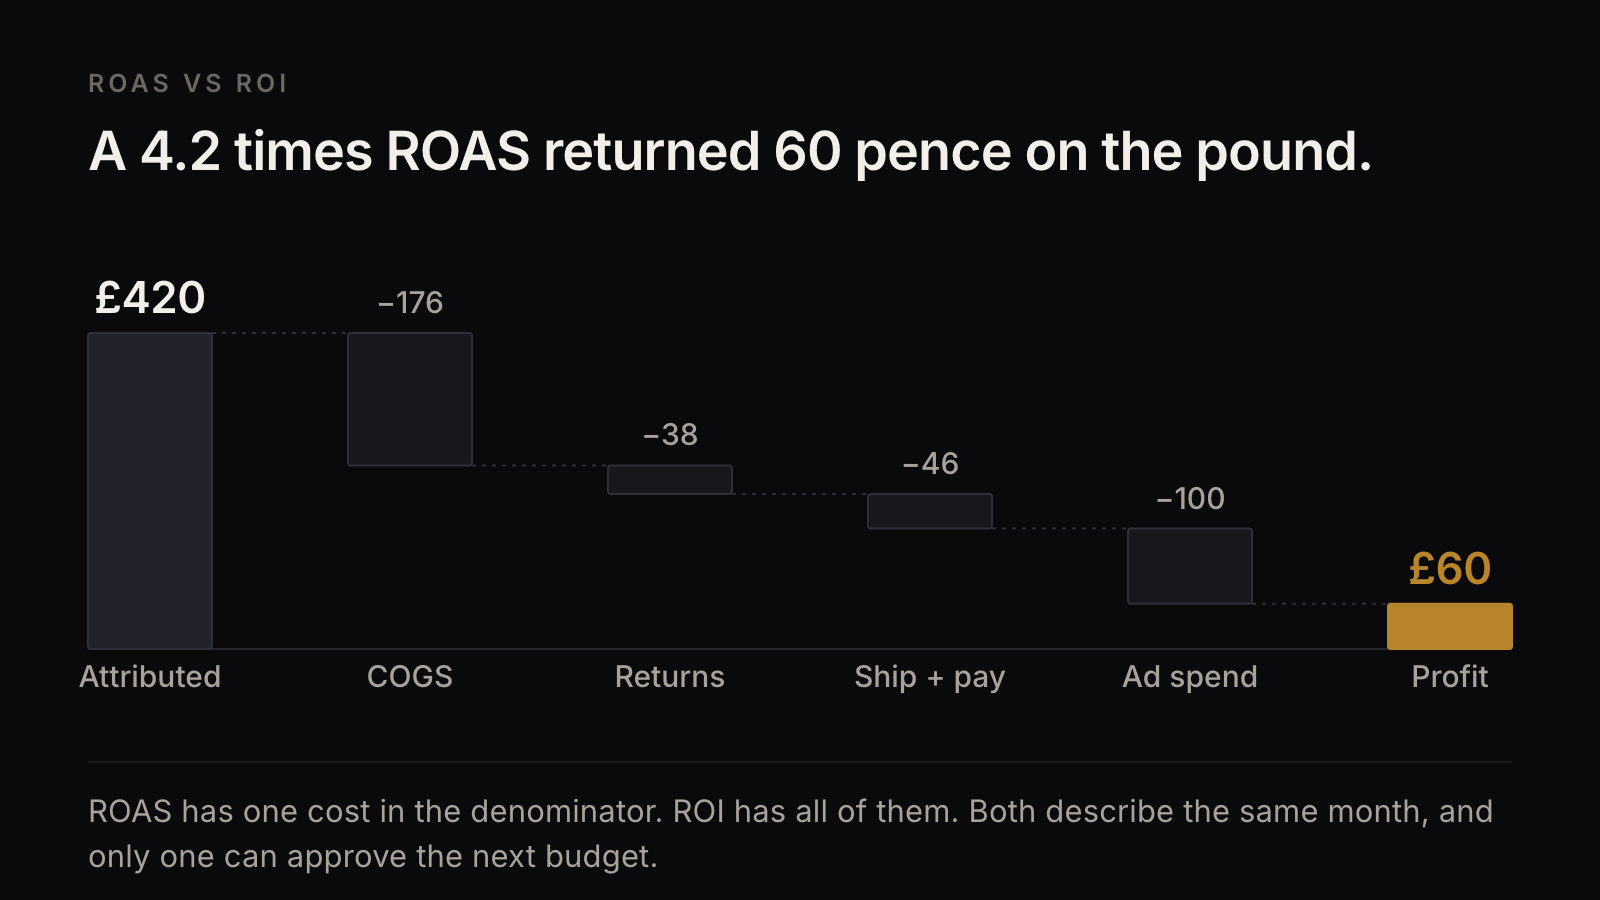
Take a clean month. You spend £100 on paid social. The platform reports a 4.2 times ROAS, so £420 of attributed revenue.
Now put the rest of the costs in.
- Product cost at 42% of revenue: £176
- Returns at 9% of revenue: £38
- Shipping and payment fees at 11%: £46
- The ad spend itself: £100
That leaves £60. You risked £100 of media to make £60. The campaign returned 0.6 times your money while the platform reported 4.2 times your spend.
Both numbers describe the same month. One of them can approve next month's budget.
Why the gap is not a rounding error
The gap between 4.2 and 0.6 is not sloppy bookkeeping. It is four structural things.
Gross margin sets the ceiling. If product cost is 42% of revenue, no amount of media skill recovers it. A brand at 70% gross margin and a brand at 45% cannot share a ROAS target and both be solvent.
Returns land after the report. The platform closes its attribution window and prints a number. The size 8 jacket comes back three weeks later. Fashion operators know this in their bones and still let the launch-week tile set the budget.
Discount is invisible in ROAS. A 20% code moves revenue and margin in the same direction, and ROAS only sees the revenue side. Cut the price, sell more, watch ROAS hold and contribution fall.
Attribution inflates the numerator. Some of that £420 would have arrived anyway. MER vs ROAS is the page for reconciling the tiles when the platforms and the blend disagree.
Which number can approve a budget
ROAS is the right instrument for a Tuesday. Which ad set do I kill this afternoon? Which creative is cheaper to serve? Those are media questions and ROAS answers them fast.
ROI, or more usefully contribution, is the right instrument for a commitment. Should this channel get another £50,000 next quarter? Should we keep buying this product at this price?
The failure is using the fast number for the slow decision. A quarterly budget approved on platform ROAS is a budget approved on one cost out of five.
Say the word you mean. If you mean “is paid efficient”, say ROAS. If you mean “are we making money”, say contribution. Unit economics for a Shopify fashion or beauty brand is the sibling on what belongs in that line.
Fashion and beauty pull them apart differently
In fashion the wedge is markdown and returns. A drop can post a strong launch-week ROAS and a negative return on the money by week six, because the size curve had to be cleared at 40% off and a third of the large sizes came back. Measure paid against the life of the style, not the launch tile.
In beauty the wedge runs the other way. A first order on a hero serum can look like a weak ROAS and a good investment, because the second and third orders do not need another £100 of media. That only holds if the repeat actually happens. A kit bought on a gift-with-purchase may never buy the hero product at full price.
Same two ratios. Opposite conclusions. The category does not decide it. The catalogue does.
A sequence you can run this week
- Pick one channel and one month. Do not average the year.
- Write the platform ROAS down and leave it alone. It is now evidence, not a verdict.
- Take attributed revenue and subtract product cost, returns, shipping and payment fees, and any discount applied.
- Subtract the media spend. Divide what is left by the media spend. That is your ROI on the attempt.
- Do it once more for your best-performing product and once for your worst. If the two answers disagree with the blended one, the blend was the problem.
Fifty orders is enough to see the shape. You are not building a model. You are checking whether the ratio that approves your budget has your costs in it.
TwoKai starts with the outcome. A number you can defend when someone asks what the money returned. Then we engineer the route.
What's missing
This page can tell you what ROAS and ROI each divide, where they separate, and which one belongs on a commitment. It cannot tell you your return rate by size, the markdown you will take to clear a style, or how much of your attributed revenue would have arrived without the spend. Those three sit on your orders, not in a blog. You can check one typed order at the ROAS calculator.
Related: Is your ROAS target making you money? · What is a good ROAS for ecommerce? · MER vs ROAS: which number do you spend against? · Unit economics for a Shopify fashion or beauty brand · Check break-even on one order
If you want that measured properly on your own orders, Explore an opportunity with TwoKai.