Checkout abandonment rate: what is in the denominator?
Someone quotes a checkout abandonment rate at you. Seventy per cent. Eighty. A figure from an industry report, or a figure from an app dashboard, and now it is in a slide.
The first useful question is what sits underneath it. Checkout abandonment rate and cart abandonment rate use different denominators, and the difference is large enough to change what you do next. One is a verdict on your checkout. The other is a verdict on everything from the product page onwards.
How to reduce cart abandonment is the sibling on the wider leak and the order of look. This page is narrower. It is about what the checkout number is counting, and where inside checkout the loss actually happens.
What the denominator actually is
Checkout abandonment rate is the share of sessions that reached checkout and did not place an order.
The denominator is sessions that reached checkout. Not sessions that added to cart. Not sessions on the site. People who loaded the first checkout step, saw a form, and were one flow away from paying.
Cart abandonment rate uses a wider denominator. Sessions that added something to a cart and did not place an order. Every add to cart is in there, including the browse-and-park behaviour that fashion and beauty produce more of than most categories.
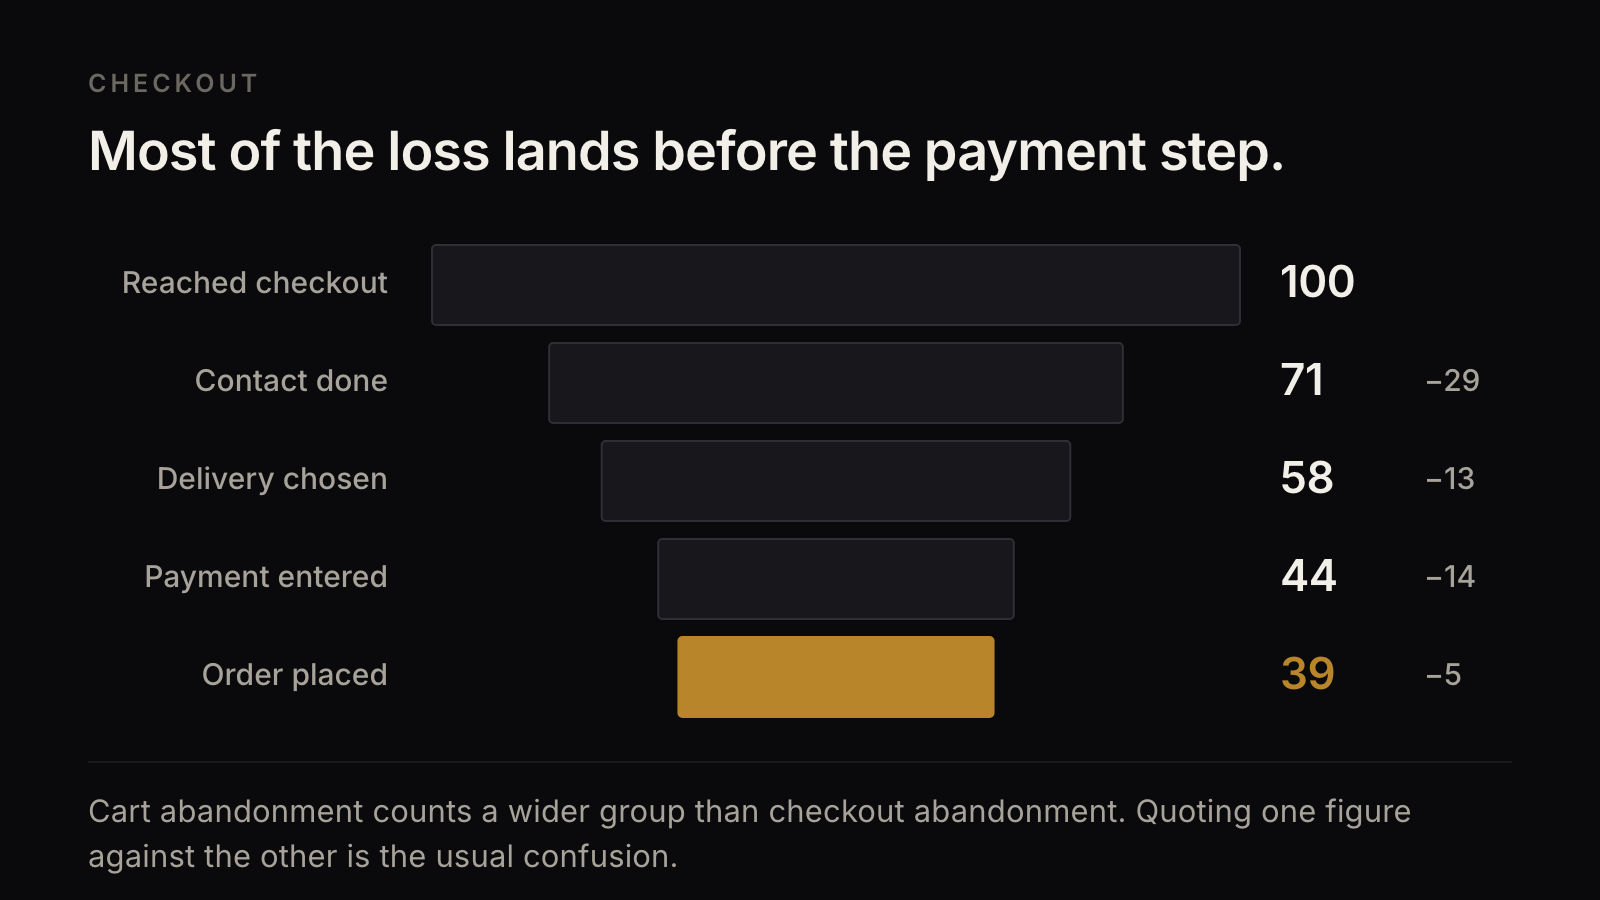
Because the denominator is wider, cart abandonment is always the bigger number. Take the funnel above. One hundred sessions reach checkout and 39 place an order, so checkout abandonment is 61%. If 250 sessions added to cart in the same week, cart abandonment on the same 39 orders is 84%.
Two numbers. Same store. Same week. Twenty-three points apart, and neither is wrong.
Why the two get confused
The published averages are the main source of the confusion. Almost every widely quoted abandonment figure, the seventy-something per cent that appears in every deck, is a cart figure. It is counted from add to cart. It gets repeated as “checkout abandonment” because the words sound interchangeable.
Your tools do not agree either. Shopify, GA4 and most checkout apps each define the entry step differently. Some count the checkout page load. Some count the first field interaction. Some count only sessions that reached the shipping step. Change the entry definition and the rate moves several points without anything on the site changing.
So when the number lands in a meeting, ask two questions before discussing it. Where does this tool start counting, and is the benchmark next to it counting from the same place?
Hold the definition still after that. A rate that changes definition halfway through an argument cannot settle anything.
The loss sits before the payment step
Most conversations about checkout abandonment jump to payment. Card declines. Wallet options. A gateway that fails on one browser.
Walk the funnel and payment is rarely where the volume goes. Of the 61 sessions lost in the example, 56 leave before they ever enter a card detail. Only five drop between entering payment and placing the order.
The three earlier steps carry the loss.
Twenty-nine leave at contact details. Thirteen leave at delivery selection. Fourteen leave when payment is presented but before anything is typed. That last group matters. They saw the total, or the delivery date, or the account requirement, and left at the point where the commitment became real.
Payment failure is a real problem and it is a small one by volume. Fixing a gateway when 92% of the loss happens upstream will move the rate by a fraction of a point.
The causes, in the order they cost you
For fashion and beauty checkouts, the drops cluster in a consistent order.
Delivery cost and speed shown too late. The single biggest cause. A shopper who has budgeted £45 sees £49.95 at the delivery step. The price did not change. The moment they learned it did. The same applies to a delivery date that lands after the weekend they were buying for.
Forced account creation. A guest who is asked to register before they can pay is being asked to do a second task. On mobile, in a hurry, that is often enough. Beauty replenishment shoppers tolerate it. First-time fashion buyers frequently do not.
A missing payment method. Not a broken one. An absent one. If your audience skews toward one wallet, or toward pay-later, and it is not on the page, those sessions leave at the payment step without a single error being logged anywhere.
Unexpected duties and taxes. Cross-border orders where import charges appear at the final step, or worse, are not mentioned at all and arrive as a message from the courier later. That kills the current order and the repeat.
None of these are checkout design problems in the visual sense. Each one is a piece of information that arrived after the shopper had already made a decision on incomplete facts.
A sequence you can run this week
The published averages cannot tell you which of the four is yours. Your own step data can, and the split is on your sessions.
- Write down what your tool counts as the start of checkout. Freeze that definition for the whole exercise.
- Pull the step counts for one week. Checkout reached, contact complete, delivery selected, payment reached, order placed.
- Find the largest single drop between two adjacent steps. That is your step, and it is probably not payment.
- Split that one step by device. Mobile and desktop rarely fail in the same place, and a mobile-only drop points at form length or a wallet.
- Split the same step by traffic source. A drop that only appears on paid social usually means the offer, the delivery promise or the price expectation was set before they arrived.
Steps 4 and 5 are the ones people skip. A blended checkout rate can look stable while mobile paid social is falling apart and desktop email is carrying the average.
What is a good ecommerce conversion rate is the judgment page when someone treats a normal fashion rate as an emergency. How to improve ecommerce conversion rate is the storefront checklist once you know which step is failing.
TwoKai starts with the outcome. Fewer sessions lost at a step you can name. Then we engineer the route.
What's missing
This page can tell you what the checkout denominator is, why the quoted averages are usually cart, and that the loss almost always sits before the payment step. It cannot tell you where your own drop sits. It cannot tell you whether it is one device, one traffic source, or one delivery threshold doing the damage. That needs your step counts, split, over a period long enough to be real.
Related: How to reduce cart abandonment · What is a good ecommerce conversion rate · How to improve ecommerce conversion rate
If you want that split run properly on your own sessions, Explore an opportunity with TwoKai.