LTV to CAC: what the ratio can and cannot settle
Every source gives the same answer. Aim for three to one. Lifetime value should be about three times what it costs to acquire the customer.
The rule is easy to repeat and hard to use. It arrived from subscription software, where a customer either keeps paying or cancels, and where nobody returns the product in a size 8. Fashion and beauty are not that shape.
First, a boundary. This page is about lifetime value against customer acquisition cost. If you are looking for loan to value on a mortgage or a home equity line, that is a different LTV and this is the wrong page.
What is a good CAC, LTV:CAC, and payback is the judgment page on the three numbers together. This one goes at the ratio itself. What it divides, where the rule came from, and the specific way a healthy-looking ratio hides an acquisition channel that never pays back.
What the ratio divides
The top is lifetime value. The bottom is the cost of acquiring one new customer.
Both halves are arguments, not facts.
On the top, “value” has at least three common meanings. Lifetime revenue. Lifetime gross profit. Lifetime contribution after returns, shipping and payment fees. The three can differ by a factor of two on the same customer. A ratio built on revenue and compared against a ratio built on contribution is not a comparison.
On the bottom, CAC has the same problem. Media only, or media plus agency fees and tools. New customers only, or every order the platform claimed. What is a good CAC, LTV:CAC, and payback is the sibling on which denominator answers which question.
Write both definitions down before you read the ratio. Most disagreements about the number are disagreements about the sum.
Where three to one came from
The three to one convention comes out of subscription software, and it made sense there. A software customer has a monthly price, a churn rate, and almost no variable cost per month. Lifetime value is close to arithmetic.
Three of those conditions fail in ecommerce.
There is no contract, so there is no churn rate, only a repeat rate you observe after the fact. There is a large variable cost on every order, so revenue and value diverge immediately. And there are returns, which take revenue back after you have already counted it.
That does not make the ratio useless. It makes the target local. A brand at 70% gross margin with genuine replenishment can be healthy below three to one. A fashion brand at 45% gross margin with a 30% return rate can be in trouble above it.
Borrowing the number without borrowing the conditions is the most common way this metric misleads a board.
Lifetime value is a forecast wearing a fact's clothes
The bottom half of the ratio is history. You know what you spent. The top half is a prediction, and it is usually the most optimistic number in the business.
Three habits inflate it.
Projecting from your best cohort. The customers who arrived through email and word of mouth two years ago will have a lovely repeat curve. They are not the customers paid social is buying today.
Extending the window until the answer improves. A twelve-month lifetime value looks poor, so someone quotes a three-year figure. Three-year value is only spendable if you can wait three years, and cash cannot.
Counting revenue as value. Gross revenue over a lifetime is a large, cheerful number that ignores the 42% you paid for the goods.
A useful discipline is to cap the window at something you can finance. Twelve months is defensible for most fashion and beauty brands. If the ratio only works at thirty-six months, the honest statement is that the business needs three years of patient cash, not that acquisition is efficient.
The blended ratio hides the channel that never pays back
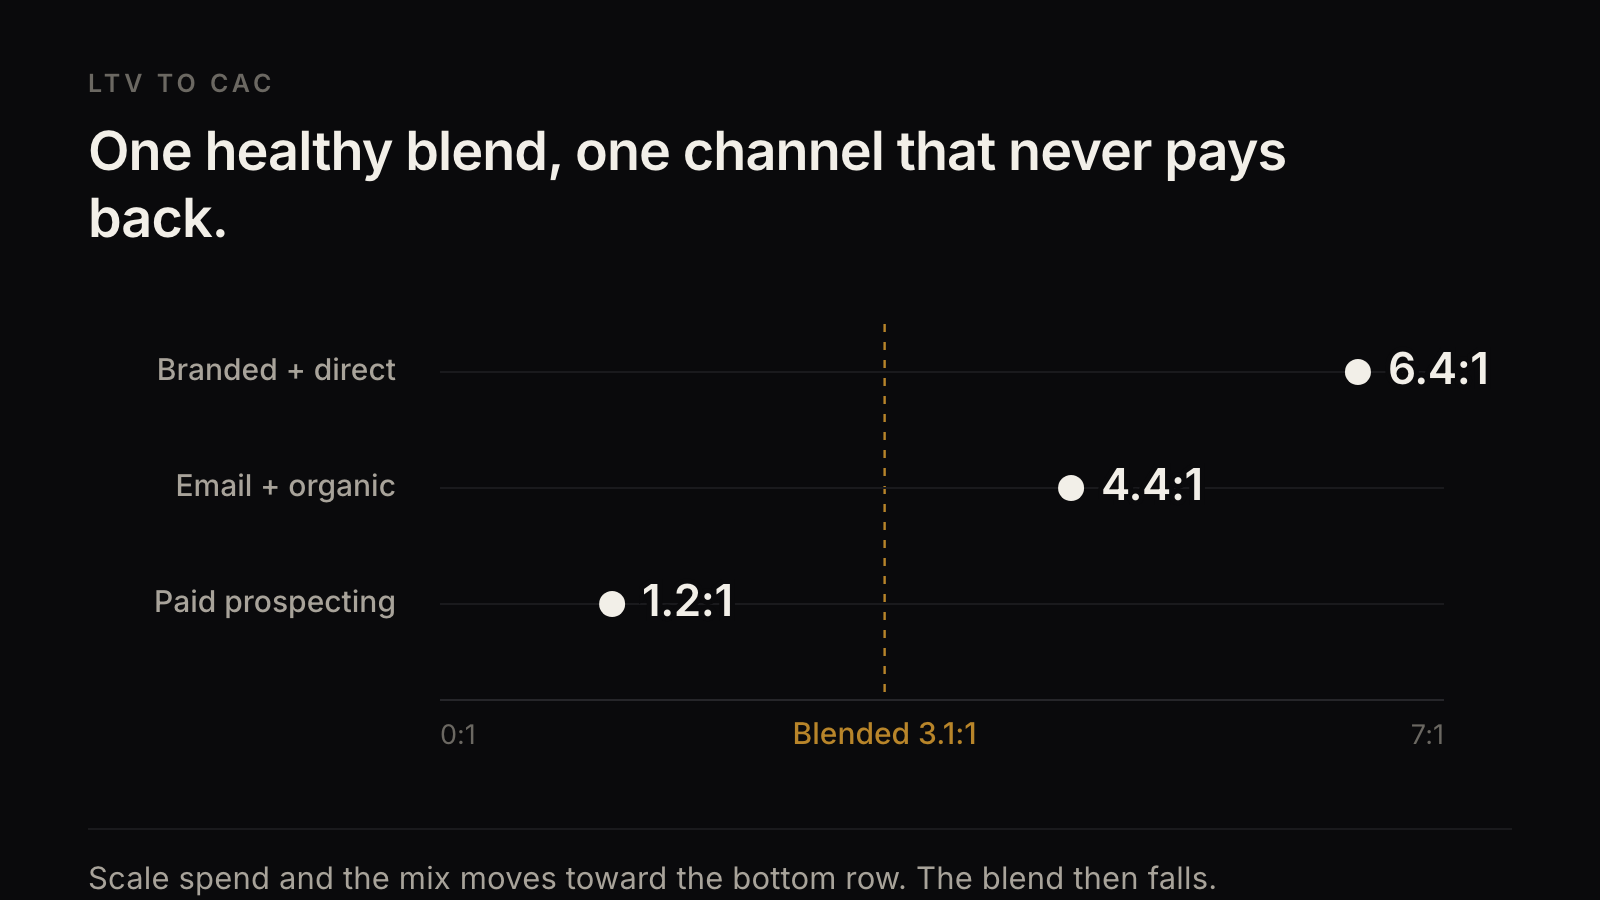
This is the failure that costs real money, and it is the reason the diagram above exists.
Take a brand with a blended ratio of 3.1 to one. On paper it clears the rule. Split it by acquisition channel and three different businesses appear.
Branded search and direct come in around 6.4 to one. These are people who already knew the brand. The ratio is excellent and the channel is not really acquisition.
Email and organic sit around 4.4 to one. Genuinely good, and largely a return on work already done.
Cold paid social prospecting sits at 1.2 to one. Every new customer bought at the margin is roughly breaking even at best, and the blended average is being propped up by demand you did not have to buy.
The blended 3.1 is arithmetically correct and commercially misleading. Scaling spend moves the mix toward the 1.2 row. The blended ratio then falls, and it looks like the channel got worse. The channel did not get worse. It was always the 1.2 row, and the average was hiding it.
Payback is the question the ratio cannot answer
Two brands can share a three to one ratio and have completely different years.
One recovers acquisition cost in two months. It can reinvest six times a year. The other recovers it in fourteen months. It can reinvest once, and only if the bank is patient.
The ratio has no time in it. That is its largest blind spot. A ratio is a shape and payback is a clock, and the clock is what decides how fast you are allowed to grow.
If you have to keep one number, keep payback. It contains most of what the ratio was trying to tell you and it answers the financing question the ratio ignores.
Fashion and beauty read the ratio differently
In fashion, the second order is the whole argument. A jacket buyer at full price with no return is a good customer. The same buyer at 40% off who returns one of two items is a cost. Both look identical inside a blended lifetime value, because both are one order of revenue.
Split by first product before you split by anything else. Fashion brands routinely find that a small group of entry styles produces most of the repeat buyers, and that the discounted entry style produces almost none. Customer retention in ecommerce is the page on why the second order is the asset.
In beauty, replenishment makes the top half more predictable and more dangerous. Predictable because a moisturiser has a natural repurchase window. Dangerous because it is tempting to assume the window will hold for a customer acquired on a kit or a gift-with-purchase. That cohort often has a genuine repeat rate near zero, and it will still be blended into a lifetime value drawn from hero-product buyers.
Tripwires
Use these as prompts to investigate, not as diagnosis.
- Ratio healthy, cash always tight. Payback is long, not efficiency poor.
- Ratio falls as you scale. The mix moved toward the marginal channel. The blend was flattering you.
- Ratio strong, second order absent. Lifetime value is being projected from a cohort you are no longer buying.
- Ratio improves after you raise discounting. You bought revenue, and value was measured on revenue.
- Two channels, same ratio, different payback. Fund the fast one first.
A sequence you can run this week
- Fix one definition of value. Contribution, not revenue. Write it on the wall.
- Cap the window at twelve months, or at whatever period your cash can actually finance.
- Recalculate the ratio using new customers only in the denominator.
- Split it by acquisition channel. Then split it again by first product.
- For the two largest rows, work out payback in months. Compare those, not the ratio.
A sample of the last few hundred new customers is enough to see whether the average is hiding a row. You are not building a lifetime value model. You are checking whether the number on the board survives being split in half.
TwoKai starts with the outcome. A ratio you can defend per channel, with a payback clock attached. Then we engineer the route.
What's missing
This page can tell you what the ratio divides, why three to one travelled badly out of software, and how a blended figure hides an unprofitable acquisition channel. It cannot tell you your own repeat curve, which of your entry products creates repeat buyers, or what your payback looks like after returns on your catalogue. That work sits on your order history.
Related: What is a good CAC, LTV:CAC, and payback? · Customer retention in ecommerce · Unit economics for a Shopify fashion or beauty brand
If you want that split measured on your own cohorts, Explore an opportunity with TwoKai.